This page comes from my Spring AI book.
The complete source is available on GitHub JavaAIDev/spring-ai-observability.
Spring AI Observability with Langfuse
Spring AI Observability provides built-in instrumentation that helps developers understand how their AI applications behave in production. Built on top of Micrometer Observability and integrated with OpenTelemetry, it automatically captures metrics, traces, and structured attributes for common AI operations such as model calls, tool execution, and agent workflows.
With observability enabled, Spring AI can emit traces that describe key aspects of an AI interaction, including the model being used, prompts and LLM responses, tool invocation details, latency, and token usage. These traces can then be exported through the OpenTelemetry ecosystem and visualized in observability platforms such as Grafana Tempo, Jaeger, or Langfuse.
This capability is particularly valuable for modern AI applications that involve multiple components, including LLM calls, retrieval pipelines, and external tools. Because it provides end-to-end visibility into how a request flows through the system. By correlating traces, metrics, and logs, Spring AI observability helps developers diagnose failures, analyze model performance, monitor token consumption, and better understand the behavior of AI agents in real-world environments.
Here I provide an example of enabling observability for Spring AI with OpenTelemetry and Langfuse.
OpenTelemetry
To enable OpenTelemetry, the following dependencies should be added to the Spring Boot project.
<dependency>
    <groupId>org.springframework.boot</groupId>
    <artifactId>spring-boot-starter-actuator</artifactId>
</dependency>
<dependency>
    <groupId>org.springframework.boot</groupId>
    <artifactId>spring-boot-starter-opentelemetry</artifactId>
</dependency>
After adding the dependencies, Spring Boot creates necessary beans to work with OpenTelemetry.
Langfuse
Langfuse is an open-source observability platform designed for applications built with large language models (LLMs). It allows developers to monitor and analyze AI interactions by capturing structured traces that include prompts, responses, tool calls, latency, and token usage.
Langfuse integrates with standards such as OpenTelemetry, enabling applications to export telemetry data and visualize complete AI workflows in a dedicated dashboard. This helps developers debug model behavior, track performance in production, and continuously improve the quality of AI-powered applications.
Langfuse is started using Docker Compose. See the docker-compose.yaml for the complete Docker Compose file to start Langfuse and its required dependencies.
Configuration
After starting Langfuse, the Spring Boot application needs to be configured to send data to Langfuse. This is done by using OpenTelemetry collector to collect data and send to Langfuse. OpenTelemetry collector is also started using Docker Compose.
OpenTelemetry collector
Below is the configuration file of OpenTelemetry collector. It defines two exporters.
-
langfuse: This exporter sends data to the OpenTelemetry API endpoint provided by Langfuse. This endpoint is available at path/api/public/otel. TheAuthorizationheader is required with the value of Langfuse API key. -
prometheus: This exporter exports data in the Prometheus format, which allows it to be scraped by a Prometheus server.
receivers:
  otlp:
    protocols:
      grpc:
        endpoint: "0.0.0.0:4317"
      http:
        endpoint: "0.0.0.0:4318"
processors:
  batch:
exporters:
  langfuse:
    endpoint: "http://langfuse-web:3000/api/public/otel"
    headers:
      Authorization: "Basic ${LANGFUSE_AUTH_STRING}"
    tls:
      insecure: true
  prometheus:
    endpoint: "otel-collector:10010"
service:
  pipelines:
    metrics:
      receivers: [ otlp ]
      processors: [ batch ]
      exporters: [ prometheus ]
    traces:
      receivers: [ otlp ]
      processors: [ batch ]
      exporters: [ langfuse ]
Spring AI App
In the configuration below, metrics and tracing data is sent to localhost:4318, which is the port of OpenTelemetry collector. management.tracing.sampling.probability is set to 1.0, so all tracing data will be collected and sent to OpenTelemetry collector.
management:
  otlp:
    metrics:
      export:
        enabled: true
        url: http://localhost:4318/v1/metrics
    traces:
      export:
        enabled: true
        url: http://localhost:4318/v1/traces
  observations:
    annotations:
      enabled: true
  tracing:
    enabled: true
    sampling:
      probability: 1.0
otel:
  logs:
    exporter: none
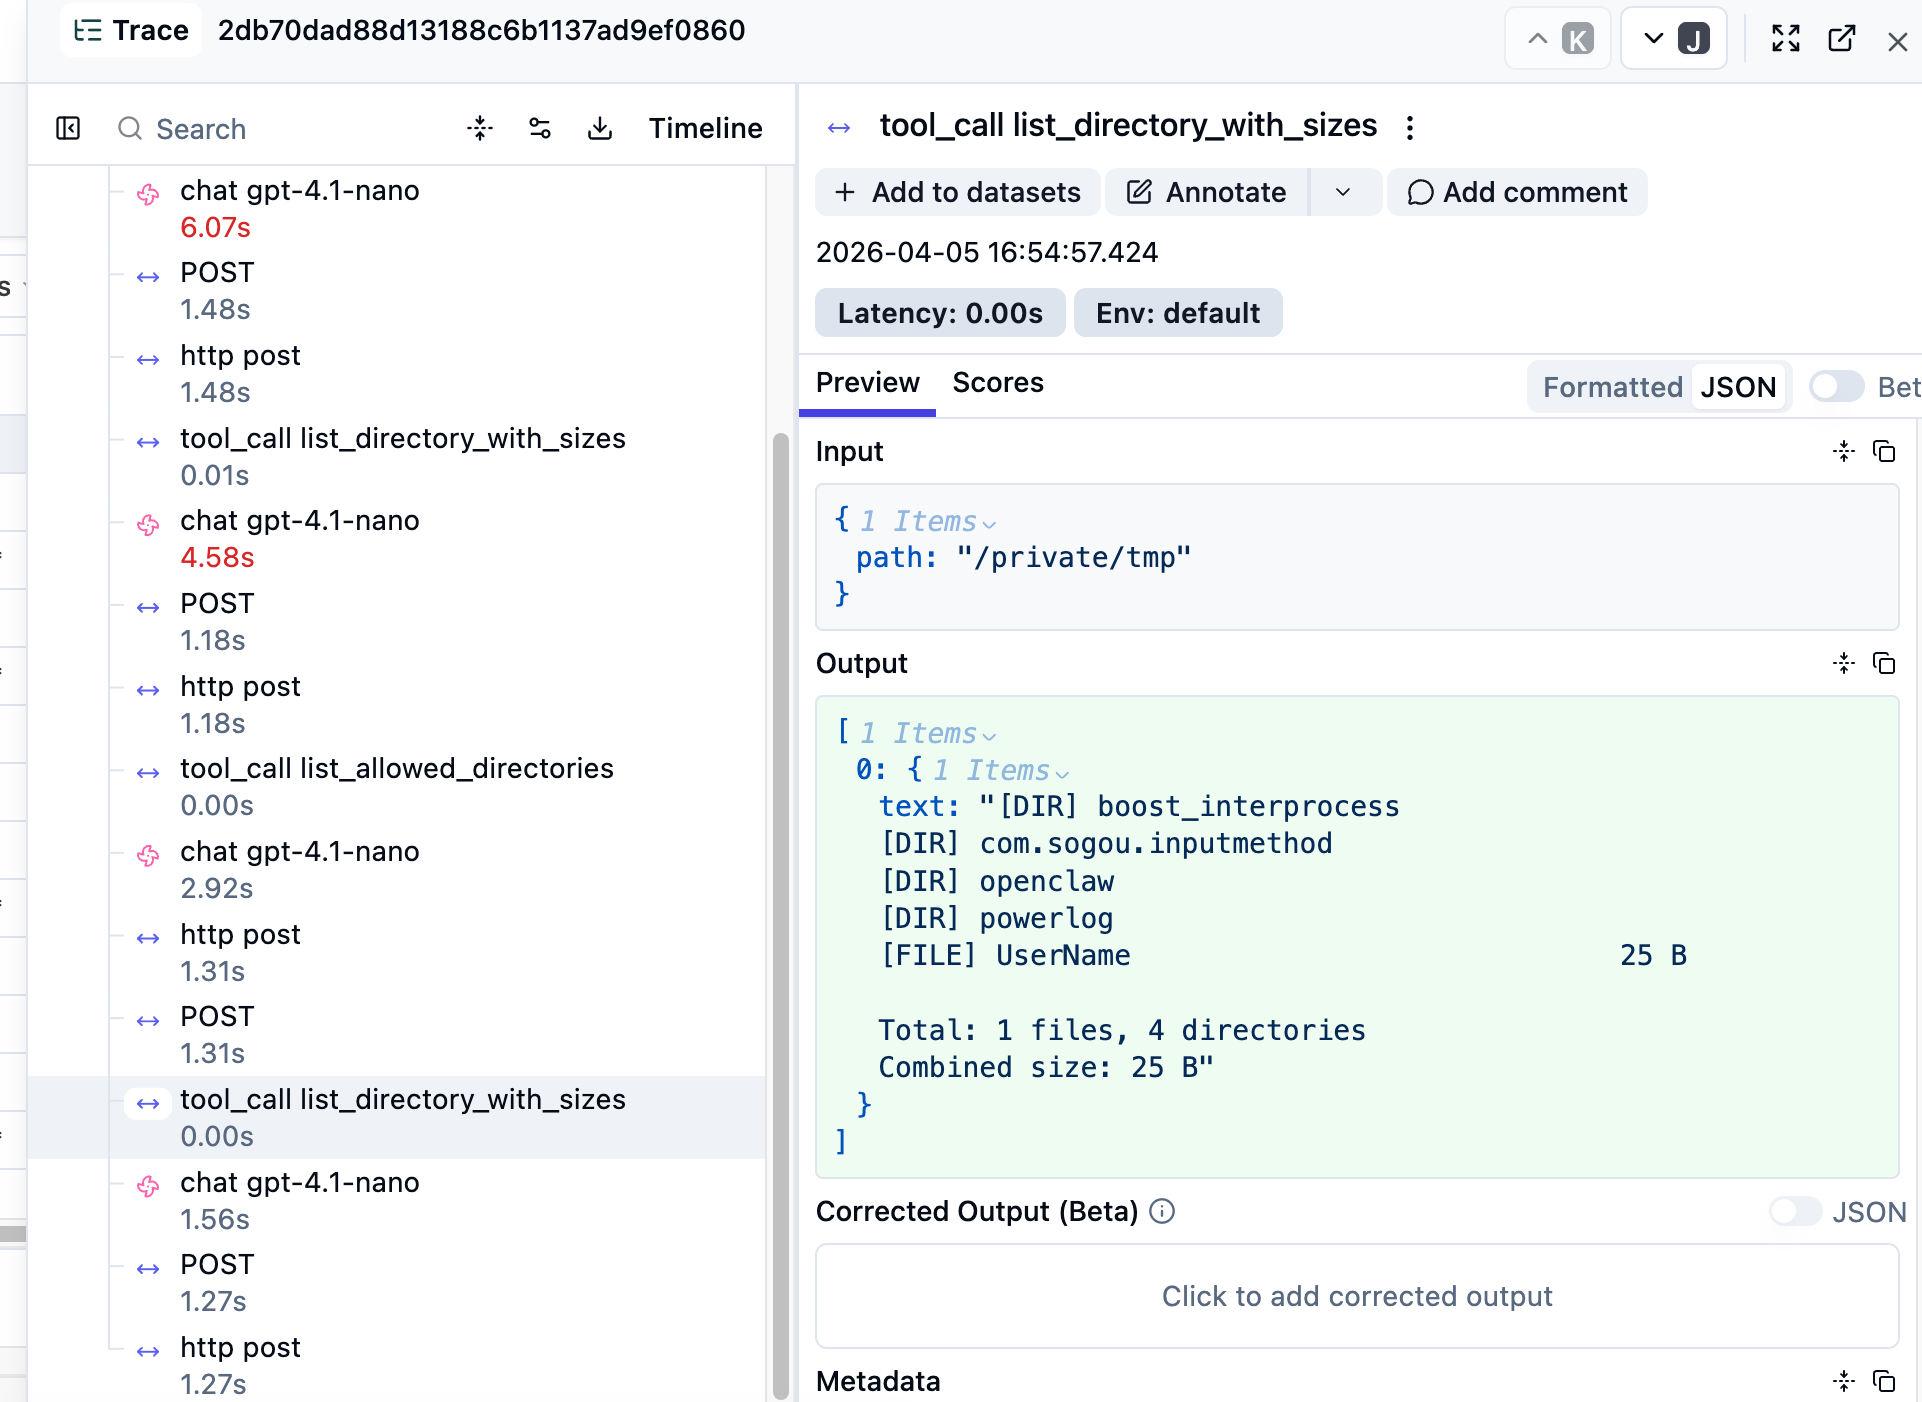
Test
After starting the Spring AI app, we can interact with it by send some messages. Open Langfuse UI to view traces. Below is the screenshot of Langfuse UI.